Article Text

Abstract
Objective Hyperferritinaemia is associated with liver fibrosis severity in patients with metabolic dysfunction-associated steatotic liver disease (MASLD), but the longitudinal implications have not been thoroughly investigated. We assessed the role of serum ferritin in predicting long-term outcomes or death.
Design We evaluated the relationship between baseline serum ferritin and longitudinal events in a multicentre cohort of 1342 patients. Four survival models considering ferritin with confounders or non-invasive scoring systems were applied with repeated five-fold cross-validation schema. Prediction performance was evaluated in terms of Harrell’s C-index and its improvement by including ferritin as a covariate.
Results Median follow-up time was 96 months. Liver-related events occurred in 7.7%, hepatocellular carcinoma in 1.9%, cardiovascular events in 10.9%, extrahepatic cancers in 8.3% and all-cause mortality in 5.8%. Hyperferritinaemia was associated with a 50% increased risk of liver-related events and 27% of all-cause mortality. A stepwise increase in baseline ferritin thresholds was associated with a statistical increase in C-index, ranging between 0.02 (lasso-penalised Cox regression) and 0.03 (ridge-penalised Cox regression); the risk of developing liver-related events mainly increased from threshold 215.5 µg/L (median HR=1.71 and C-index=0.71) and the risk of overall mortality from threshold 272 µg/L (median HR=1.49 and C-index=0.70). The inclusion of serum ferritin thresholds (215.5 µg/L and 272 µg/L) in predictive models increased the performance of Fibrosis-4 and Non-Alcoholic Fatty Liver Disease Fibrosis Score in the longitudinal risk assessment of liver-related events (C-indices>0.71) and overall mortality (C-indices>0.65).
Conclusions This study supports the potential use of serum ferritin values for predicting the long-term prognosis of patients with MASLD.
- NONALCOHOLIC STEATOHEPATITIS
- FIBROSIS
Data availability statement
All data relevant to the study are included in the article or uploaded as online supplemental information.
This is an open access article distributed in accordance with the Creative Commons Attribution Non Commercial (CC BY-NC 4.0) license, which permits others to distribute, remix, adapt, build upon this work non-commercially, and license their derivative works on different terms, provided the original work is properly cited, appropriate credit is given, any changes made indicated, and the use is non-commercial. See: http://creativecommons.org/licenses/by-nc/4.0/.
Statistics from Altmetric.com
Disclaimer: this video summarises a scientific article published by BMJ Publishing Group Limited (BMJ). The content of this video has not been peer-reviewed and does not constitute medical advice. Any opinions expressed are solely those of the contributors. Viewers should be aware that professionals in the field may have different opinions. BMJ does not endorse any opinions expressed or recommendations discussed. Viewers should not use the content of the video as the basis for any medical treatment. BMJ disclaims all liability and responsibility arising from any reliance placed on the content.
WHAT IS ALREADY KNOWN ON THIS TOPIC
Serum hyperferritinaemia is associated with liver disease severity and fibrosis in metabolic dysfunction-associated steatotic liver disease (MASLD). Preliminary evidence suggested that serum ferritin levels might have prognostic implications, but no robust evidence has been so far achieved.
WHAT THIS STUDY ADDS
Baseline hyperferritinaemia is associated with 50% risk of liver-related events and 27% of all-cause mortality, with a stepwise increase from values 215.5 µg/L and 272 µg/L, respectively. The inclusion of ferritin improves the performance of Fibrosis-4 Score (FIB-4) and Non-Alcoholic Fatty Liver Disease Fibrosis (NFS) Score for the prediction of liver-related events and all-cause mortality.
HOW THIS STUDY MIGHT AFFECT RESEARCH, PRACTICE OR POLICY
These results suggest a longitudinal role for serum ferritin values in the risk stratification of MASLD patients.
Introduction
Serum ferritin assessment is part of the investigational panel to rule out other causes of liver damage in patients with suspected metabolic dysfunction-associated steatotic liver disease (MASLD),1 formerly known as non-alcoholic fatty liver disease (NAFLD). Hyperferritinaemia, in the absence of significant iron overload, is detected in up to 30% of patients with MASLD.2 As an acute-phase protein, serum ferritin is also actively synthesised during inflammatory processes or in the setting of increased intracellular oxidative stress. Hyperferritinaemia has been widely reported in low-grade metabolic systemic inflammation conditions such as visceral obesity and type 2 diabetes mellitus (T2DM).3 Large cross-sectional studies have demonstrated a significant association of increased ferritin with the severity of liver fibrosis in patients with MASLD,4–6 especially in men and in those with a genetic predisposition to iron accumulation.7 Although normal ferritin levels, or less elevated, may reasonably exclude the presence and severity of liver fibrosis, serum ferritin on its own seems to lack overall accuracy in distinguishing between patients with or without severe or advanced liver fibrosis.8
In addition, the role of ferritin in the prediction of long-term outcomes in patients with MASLD is still uncertain. Hyperferritinaemia has been associated with increased mortality in patients with decompensated liver disease and patients on the liver transplantation waiting list.9 10 In a single-centre longitudinal study with 16 years of follow-up, high ferritin levels in patients with MASLD have been related to increased mortality, even after adjusting for confounders at baseline (age, sex, smoking, body mass index (BMI), diabetes, hypertension, cardiovascular disease and fibrosis stage). However, from the 713 patients with MASLD initially included, ferritin levels were only available in 222 cases.11
The main aim of this study was to test the potential predictive value of serum ferritin on hepatic as well as extrahepatic outcomes and all-cause death among individuals with biopsy-proven MASLD. In particular, we evaluated the role of both the standard definition of hyperferritinaemia and different ferritin thresholds in the prediction models of hepatic/extrahepatic outcomes and all-cause death.
Materials and methods
We performed a multicentre cohort study of biopsy-confirmed MASLD patients from tertiary centres in Italy (Turin, Milan, Rome, Palermo), UK (Newcastle upon Tyne), Spain (Seville), Germany (Mainz), Sweden (Linköping and Stockholm) and Australia (Sydney). Inclusion criteria were the diagnosis of MASLD confirmed by liver biopsy, age ≥18 years and available baseline value of serum ferritin. Ferritin levels of 300 µg/L for men and 200 µg/L for women were considered the ‘upper limit of normal’ (ULN).7 12
A flow chart for the selection of the study subjects is shown in figure 1. Liver biopsies were performed from 1974 to 2015 for the suspicion of significant liver injury or fibrosis, based on the presence of chronically-altered liver biochemistry or hepatic steatosis at ultrasound. All biopsies were locally read and judged appropriate for analysis (average length of 25 mm and minimum 10 portal tracts) by expert liver pathologists, using the Clinical Research Network scoring system for MASLD histological grading and fibrosis staging.13 A threshold of 5% of hepatocytes showing steatosis was required for the diagnosis of MASLD. Metabolic dysfunction-associated steatohepatitis (MASH) was diagnosed when the combined presence of steatosis, lobular inflammation and ballooning was detected. Significant fibrosis was defined as fibrosis stage ≥2. Advanced fibrosis was defined as fibrosis stage ≥3. No signs of iron accumulation were detected in histology.

Flow chart of the study. ALT, alanine aminotransferase; AST, aspartate aminotransferase; BMI, body mass index; HCC, hepatocellular carcinoma; MASLD, metabolic dysfunction-associated steatotic liver disease.
Exclusion criteria were represented by other causes of liver disease, including alcohol-related liver disease (cut-offs for exclusion of alcohol-induced liver disease were ≤210 g/week in men and ≤140 g/week in women; the history of alcohol consumption was estimated from standard clinical interviews during both the first visit and follow-up, based on medical records); iron overload caused by genetic predisposition (haemochromatosis, which was excluded by selecting patients with transferrin saturation ≤50% in men and ≤45% in women); Wilson disease and other cholestatic or autoimmune liver diseases; drug-induced liver injury caused by hepatotoxic medications (including methotrexate, systemic steroids, valproic acid, tamoxifen); viral hepatitis caused by hepatitis C and hepatitis B viruses.
At the time of the liver biopsy, clinical, anthropometric and laboratory data had been collected, including full blood count, routine liver biochemistry and metabolic profiling including glucose, lipids and iron. T2DM was diagnosed based on fasting serum glucose level ≥125 mg/dL or on active treatment. At the time of liver biopsy, none of the enrolled patients had clinical or radiological signs of decompensated cirrhosis. The baseline diagnosis of cirrhosis was exclusively based on histology.
For the longitudinal analysis, a minimum of 6 months of follow-up was recorded for each patient. For the Swedish cohort, longitudinal data were obtained from national registers. Medical visits were performed every 6 (for cirrhotic patients) or 12 months by hepatologists. Subjects whose health status was unknown for more than 12 months were considered lost at follow-up. Recorded events included liver-related outcomes (ascites, hepatic encephalopathy, oesophageal varices bleeding), the occurrence of hepatocellular carcinoma (HCC, defined by compatible radiological and/or histological findings), cardiovascular events (including acute coronary syndrome, peripheral arterial ischaemia, acute cerebrovascular events), extrahepatic cancers (both epithelial and haematological neoplasia) and all-cause death.
MASLD treatment consisted of standard recommendations for lifestyle changes, including both increased physical activity and dietary changes.
Patients with histological evidence of cirrhosis underwent ultrasound surveillance for HCC and those who developed portal hypertension further underwent endoscopic screening for gastro-oesophageal varices, according to guidelines by liver societies.
Statistical analysis
Patients were divided into ‘high serum ferritin’ (HSF) and ‘normal-low serum ferritin’ (NLSF) groups, considering ferritin levels of 300 µg/L for males and 200 µg/L for females. The baseline characteristics of these two groups were compared using χ2 and Kolmogorov-Smirnov tests for nominal factors and numeric values, respectively. Longitudinal analysis was then performed to evaluate the ability of different ferritin values to discriminate the long-term incidence of the following outcomes, recorded at the end of the follow-up in each patient: liver-related events, HCC, cardiovascular events, extrahepatic cancer and overall mortality. Specifically, the evaluations were performed considering patients at: (1) HSF vs NLSF; (2) different cut-offs of ferritin values from 10th to 90th percentiles, defined from the entire patients’ cohort. Cut-offs dividing the ferritin values into two classes with one reporting ≤10 events were excluded from evaluations.
The predictive power of the ferritin values concerning the long-term outcomes was assessed by applying a 5-time repeated 5-fold cross-validation of Cox proportional hazard regression and its regularised versions, that is, Lasso, Ridge and Elastic Net regressions.14 Regularisation is a method for preventing overfitting by controlling model complexity. It accomplishes this by penalising the coefficients of predictors that do not provide meaningful information to the model. Lasso penalisation allows for the generation of a sparse model (setting unimportant covariates to 0), while Ridge penalisation avoids the feature selection set by lasso by encouraging a grouping effect of the covariates used in the model. Finally, Cox regression combined with Elastic Net penalisation combines both lasso and ridge penalty terms to identify the more representative covariates in each group that contribute most to modelling the outcome. All the penalty terms were determined through cross-validation.
These four models were applied considering both ferritin and the following confounders: sex, age at biopsy, BMI, baseline T2DM, alanine aminotransferase (ALT) and aspartate aminotransferase (AST). For inclusion in the prediction model, each confounder with continuous values was binarised using the following thresholds: age at 50 years, BMI at 30 kg/m2, ALT at 50 IU/L, AST at 36 IU/L following common clinical guidelines. Sex was excluded as a confounder in the evaluation of the groups of patients differentiated according to ULN, since the sex of the patients already conditions the state-of-the-art thresholds used to define these groups. To avoid the model overfitting, in each training set the penalty regularisation hyperparameters were set using 5-fold cross-validation. Splits of the dataset were prepared to have at least one event at either low or high ferritin values, keeping a balanced distribution of the events. Harrell’s C-index was used to assess the model performance. Specifically, the same training/test folds were used to compare the C-index obtained by the full model with respect to the C-index from the same model using only the confounders as variables. All C-indices resulting from the cross-validation were then compared using a one-sided Wilcoxon signed rank test. In addition, for each training/test fold, the difference between these C-indices was calculated and will be referred to as ∆C-index in the following. A positive ∆C-index indicates a gain in the prediction performance of the model when serum ferritin is considered a covariate.
Finally, we evaluated whether the ferritin can be informative according to the estimated Hazard Ratio (HR) and increase the prediction performance in terms of ∆C-index when combined with the non-invasive scoring systems Fibrosis-4 (FIB-4)15 and NAFLD Fibrosis Score (NFS),16 which are used to stratify patients with MASLD who are at risk of advanced fibrosis. Specifically, these two scores were calculated at the time of liver biopsy according to their originally reported formula:
FIB-4: (age [years]×AST [U/L])/([platelets (×109/L)]×√ALT [U/L]).
NFS: 1.675+0.037× age (years)+0.094×BMI (kg/m2)+1.13×IFG/diabetes (yes=1, no=0)+(0.99×AST/ALT ratio) (0.013×platelet [×109/L]) (0.66×albumin [g/dl]).
The analyses were performed in the R environment (V.4.1.2), using the main R packages survival (V.3.2–13), glmnet (v. 4.1–4) and WRS2 (V. 1.1–4).
Results
Baseline characteristics of the study cohort
A total of 1474 patients were considered. The baseline characteristics of the whole study population subdivided into a HSF and NLSF groups according to ULN thresholds are displayed in table 1. Hyperferritinaemia was found in 438 patients (29.7%), who were mostly males, older, with a higher prevalence of obesity and T2DM compared with the NLSF group. MASH was diagnosed in 61% of cases with no difference between the two groups (64.0% at high ferritin vs 60.4%, p=0.12). Overall, advanced fibrosis was found in 20% of the patients. A higher proportion of patients with HSF had liver fibrosis (any stage) (77% vs 69%, p=0.0029), as well as significant fibrosis (≥F2) (55% vs 35%, p<0.001) and advanced fibrosis (F3-4) (27% vs 17%, p<0.001) (table 1).
Demographic, clinical and histological characteristics of the patient population as a whole and subdivided into a ‘high serum ferritin’ (HSF) and a ‘normal-low serum ferritin’ (NLSF) groups†
Long-term outcomes of the study cohort
The minimum follow-up time for the whole cohort was 6 months (range 6–540, median 96 months) (figure 1). Sixty-seven patients were excluded for missing information on confounders (age, BMI, T2DM, ALT and AST). Hence, longitudinal analyses were performed on 91% of the subjects (1342/1474). During the follow-up, 7.7% (103/1332) of them developed liver-related events, 1.9% (25/1330) HCC, 10.9% (139/1265) had cardiovascular complications and 8.3% (92/1109) were diagnosed with extrahepatic cancers. Overall, 5.2% (70/1342) of the patients died.
Longitudinal analysis: HRs of HSF for long-term outcomes
According to current guidelines, serum ferritin values ≥300 µg/L for males and ≥200 µg/L for females were the threshold levels set for the definition of HSF versus NLSF groups. Cox model and its penalised versions were trained and tested with 5-fold cross-validation, repeating the procedure five times. For the preliminary evaluation of the main associations between HSF and long-term outcomes, we considered the median HRs and CIs for the serum ferritin values observed from the multivariable Cox regression models applied to the training datasets of the cross-validation. Table 2 reports the results obtained from the models in the training sets. Except for cardiovascular events, median HRs higher than 1.26 for all long-term outcomes and all-cause death were observed, with significant Wald test for extrahepatic cancer, and p values<0.1 for liver-related events and mortality. It is worth pointing out that hazards for HCC showed a high variability due to the lower number of events available (25 in total).
Median HRs of hyperferritinaemia (HSF vs NLSF groups) for long-term outcomes (multivariate Cox regression models)
Longitudinal analysis: HRs of increasing serum ferritin thresholds for long-term outcomes
We then investigated the hazards’ changes according to increasing ferritin thresholds by percentiles. Figure 2 shows the average HRs from the Cox models considering the training splits of the cross-validation at ferritin values ranging from 10th to 90th percentiles. Online supplemental figure 1 and online supplemental table 1 report the median hazards for each long-term outcome. Due to the low number of events, the performance of serum ferritin on HCC prediction was evaluated only at two ferritin thresholds (215.5 and 272 µg/L), that included at least more than 10 events at either high or low ferritin values.
Supplemental material

HRs of increasing serum ferritin thresholds for long term outcomes (multivariate Cox regression models). For each long-term outcome, the figure reports the average HRs and standard errors obtained on the training sets from the cross-validation of the multivariate Cox models, considering different thresholds for serum ferritin levels, ranging between the 10th and the 90th percentiles (x-axis). Confounders of the models: age, sex, BMI, T2DM, AST and ALT. All the obtained models showed a statistically significant log-rank test p value (<0.01). *Showing median Wald test p value of serum ferritin coefficient <0.05, ∧Showing median Wald test p value of serum ferritin coefficient <0.1. ALT, alanine aminotransferase; AST, aspartate aminotransferase; BMI, body mass index; HCC, hepatocellular carcinoma; T2DM, type 2 diabetes mellitus.
Except for cardiovascular events, HRs for long-term outcomes showed a stepwise increase by increasing ferritin thresholds, which was confirmed by statistical significance through the median p values from the Wald test applied to the corresponding ferritin coefficient (figure 2). Specifically, ferritin values above the 60th percentile (215.5 µg/L) were significantly associated with median HRs>1.70 for liver-related events and extrahepatic cancers, which achieved a median HR=2.11 at the 90th percentile (535.2 µg/L). For the overall mortality, serum ferritin values above 272 µg/L (70th percentile) were associated with a median HR>1.40, reaching a median HR=1.82 at 366.4 µg/L (80th percentile), showing statistical significance (figure 2 and online supplemental tables 1 and 2). It was not possible to test the mortality at the 90th percentile due to the low number of events. However, the trend of the HR values at lower ferritin thresholds suggests that higher HRs are expected at ferritin values >366.4 µg/L.
Performance of serum ferritin in predicting long-term outcomes in patients with MASLD
To evaluate the contribution of serum ferritin (either as HSF or at different thresholds by percentiles) to multivariate prediction models, we compared the ‘full’ models including serum ferritin and the corresponding ‘null’ models using only confounders in terms of C-index calculated on the test sets from the cross-validation. The variations between these C-indices were then statistically compared using a one-sided Wilcoxon signed rank test.
When the ULN-defined groups were considered (table 3), three (out of four) prediction models for the liver-related events (ie, Cox without regularisation, Ridge and Elastic Net) achieved median C-indices between 0.67 and 0.68 showing a statistically significant increase of the predictive performance with respect to the null model (range 0.01–0.02). The highest C-indices were observed for HCC, with two prediction models (Cox and Ridge regression) achieving median C-indices of 0.86 and 0.84, respectively (average increase with respect to the corresponding null model of 0.01 and 0.02). Likewise, for mortality, all penalised models resulted statistically significant with median C-indices ranging between 0.65 and 0.69, respectively (average increase of 0.01). For the extrahepatic cancers, hyperferritinaemia showed a significant impact in the prediction of this outcome only in one case (when Ridge-penalised Cox model was applied), achieving a median C-index equal to 0.69 (average ∆C-index=0.01). Confirming the previous analysis, no incremental prediction performance of serum ferritin was observed for cardiovascular events.
Multiple models testing prediction of long-term outcomes by hyperferritinaemia (HSF vs NLSF groups)
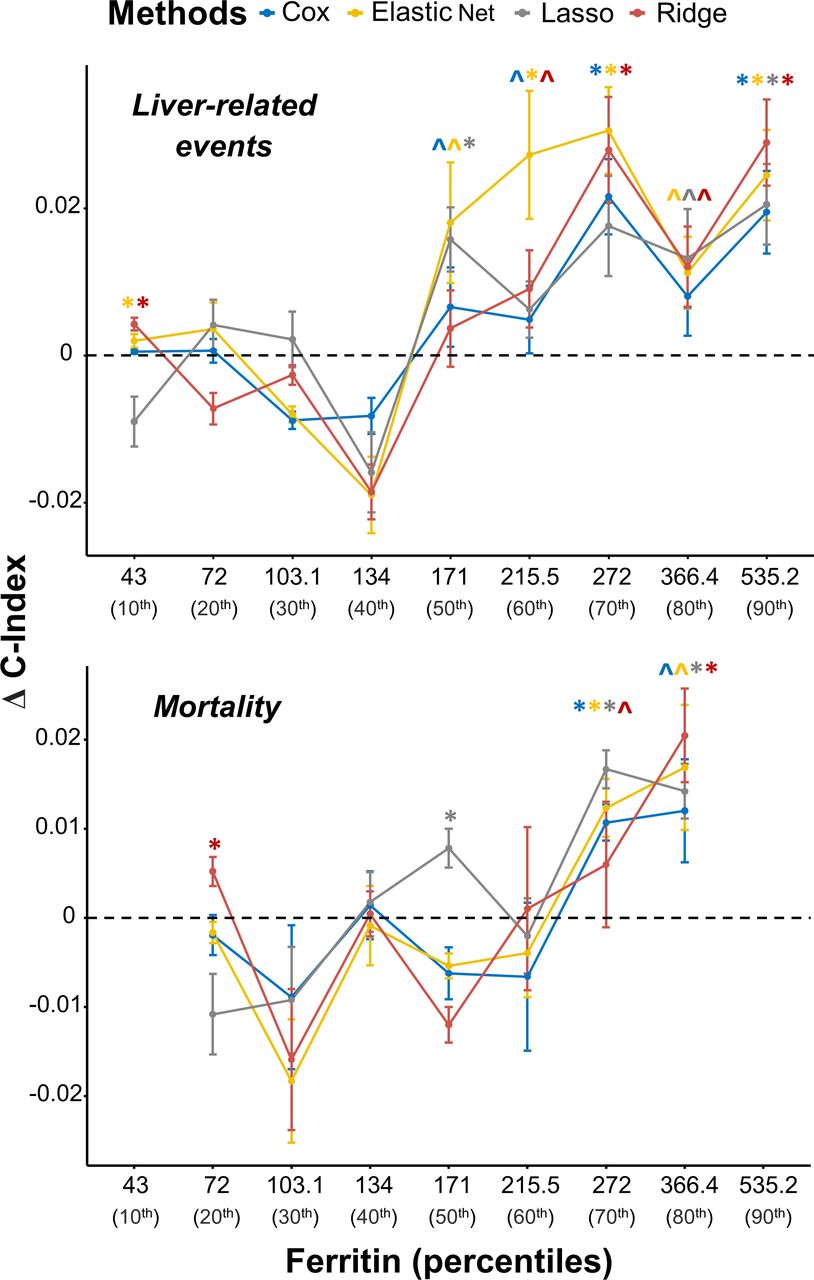
Then, we repeated the same evaluation for serum ferritin at increasing percentiles cut-offs to investigate consistent trends of the C-index variations by increasing serum ferritin thresholds (figure 3). Specifically, for liver-related events, an incremental gain in terms of C-index was observed starting from ferritin values at the 50th percentile (171 µg/L). From this threshold onwards, a statistical increase in C-index, ranging between 0.02 (with lasso-penalised Cox regression) and 0.03 (with ridge-penalised Cox regression), was achieved at serum ferritin levels of 272 µg/L and particularly at 535.2 µg/L, the highest ferritin threshold (90th percentile). An incremental gain in terms of prediction was also observed for overall mortality, becoming statistically significant for three models at the 70th percentile (272 µg/L). At 80th percentile the ∆C-index resulted statistically significant for both Cox and its Ridge-penalised version but had higher variability (figure 3), due to the low number of events available. However, for the other models, the p values are <0.1.

Variations of Harrell’s C-indices measuring the predictive role of serum ferritin at different cut-offs with respect to liver-related events and mortality. The difference between the Harrell’s C-indices obtained by the full model including the serum ferritin with respect to those obtained by the null model with only confounders is reported in the y-axis (∆C-index). Cox proportional hazard model and its penalised variants (ie, Lasso, Ridge and Elastic Net) were applied, considering serum ferritin values at different cut-offs, corresponding to the range 10th - 90th percentiles (x-axis). Confounders: age, sex, BMI, T2DM, AST and ALT. *Reporting statistically higher C-indices with respect to the same model tested on the same cross-validation split but considering only confounders, according to the one-sided Wilcoxon signed rank test (p value <0.05); ∧p value <0.1 on the same test. Colours are displayed according to the methods reported in the legend. ALT, alanine aminotransferase; AST, aspartate aminotransferase; BMI, body mass index; T2DM, type 2 diabetes mellitus.
Considering the other outcomes, reported in online supplemental figure 2, the most consistent gain in the prediction performance for extrahepatic cancers was observed above the 60th percentile of serum ferritin values (215.5 µg/L) with statistically significant ∆C-indices from all four prediction models, but with variable trends of the ∆C-indices at higher thresholds compared to liver-related events and mortality. High variability was also observed for HCC, caused by the limited number of events, despite C-indices ranging between 0.79 and 0.88 (online supplemental table 2). However, the inclusion of serum ferritin as a covariate did not change the high prediction performance of the additional confounders considered in the model (i.e., sex, age, BMI, T2DM, ALT and AST). Finally, cardiovascular events are confirmed to be the least likely predicted by serum ferritin.
The inclusion of serum ferritin in models with non-invasive scoring systems can improve the prediction of liver-related events and death in patients with MASLD
We finally evaluated whether serum ferritin can increase the prediction of the long-term outcomes in combination with non-invasive scoring systems (FIB-4 and NFS) in terms of C-index. Observing the HRs in the training sets for the Cox model, serum ferritin was able to show a statistically significant impact in liver-related events, extrahepatic cancer and mortality with median HRs≥1.2 for both scores (online supplemental tables 3 and 4), with the highest median HR observed for liver-related events (median HR=1.30 and =1.43 for FIB-4 and NFS, respectively). In terms of prediction performance on the test sets, we observed that, for both FIB-4 and NFS, the ∆C-index was statistically significant for predicting liver-related events in all four models and for predicting mortality in three out of the four models (tables 4 and 5).
Multiple models testing prediction of long-term outcomes by serum ferritin combined with FIB-4 to predict long-term outcomes
Multiple models testing prediction of long-term outcomes by serum ferritin combined with NFS to predict long-term outcomes
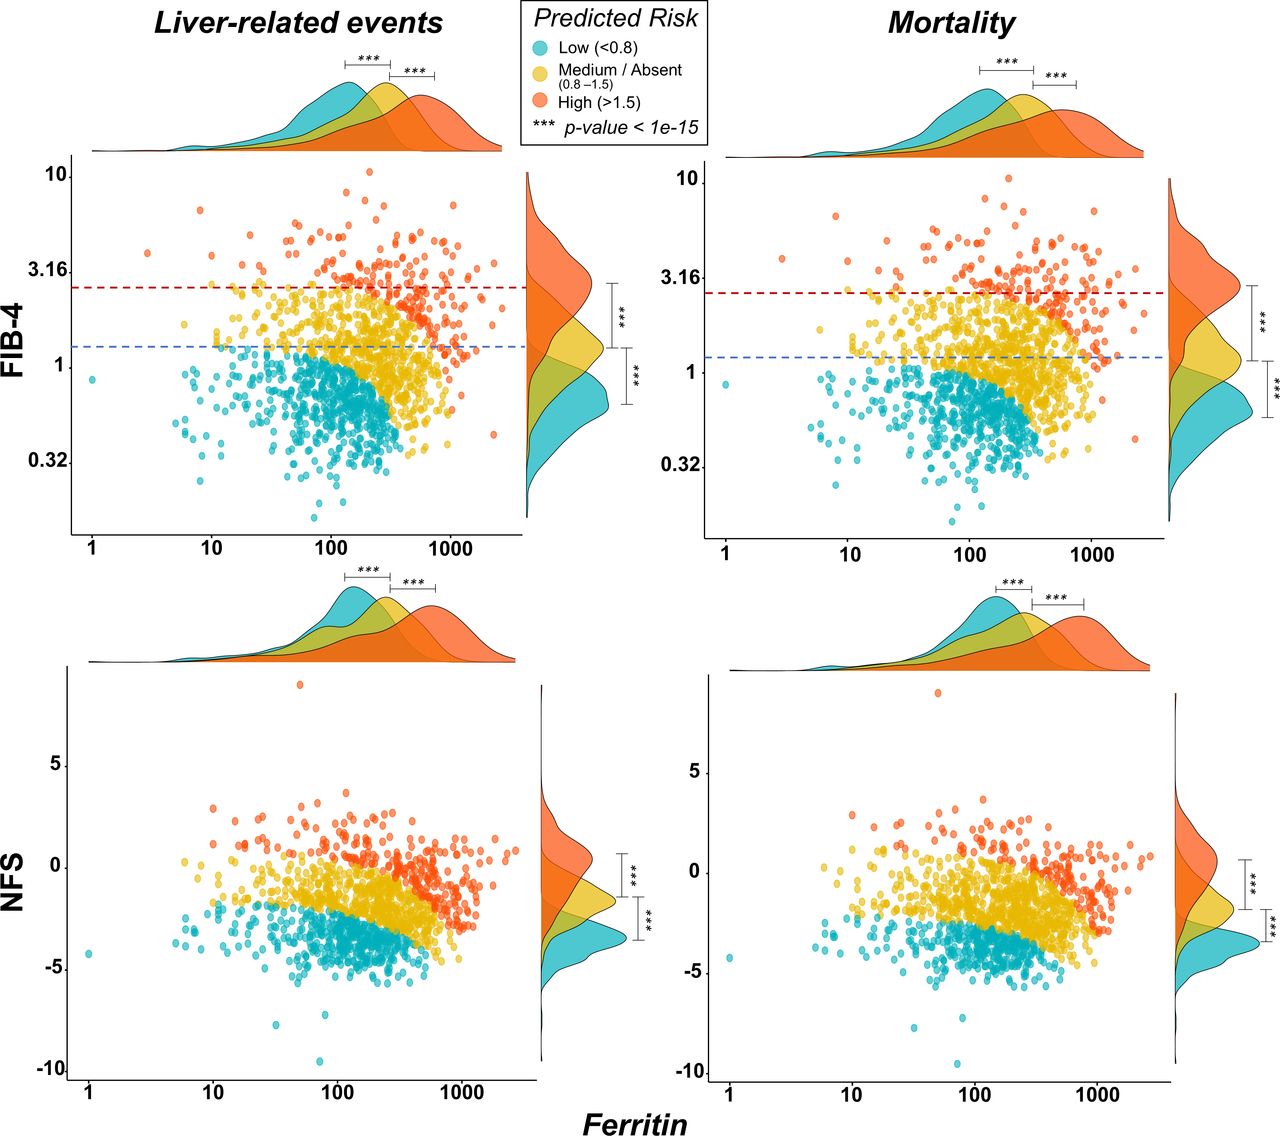
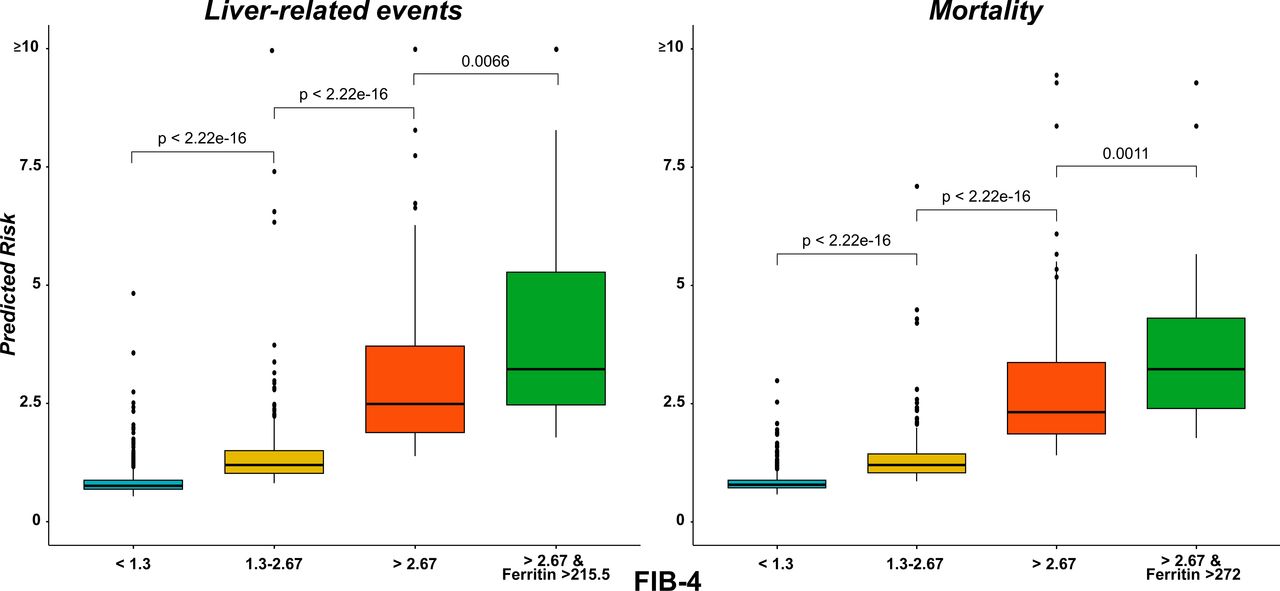
Lastly, we also evaluated the risk distributions of liver-related events and mortality estimated by Cox model when we combined FIB-4 or NFS with serum ferritin values (figure 4). For each category of risk (low, medium and high), high ferritin values can significantly change the risk of either developing a liver-related event or dying, with predictive performance as reported in tables 4 and 5 (first row, corresponding to Cox model). The figure highlights thresholds commonly used for FIB-4 (1.3 and 2.67). It is worth noticing that, at low ferritin values (<100 µg/L), these thresholds correctly separate low, medium and high predicted risks. For higher ferritin values, the risk is influenced by the ferritin, and levels above 500 µg/L identified the great majority of subjects at high risk for liver-related events and overall mortality, even when FIB-4 is below 1.3 or NFS<−1.5. Figure 5 reports the different performance of FIB-4 risk categories in the prediction of liver-related events and mortality. Notably, the predictive performance of the high FIB-4 threshold for the risk of liver-related events and mortality is increased by the combination with the main predictive serum ferritin cut-offs (215.5 µg/L for liver-related events and 272 µg/L for mortality, respectively, highlighted in the previous analyses).

Distribution of predicted risk scores (low vs medium vs high) in liver-related events and mortality from Cox models considering the combination of FIB-4 and NFS with serum ferritin values as continuous variables. Colours are displayed according to the thresholds of the estimated relative risks reported in the legend. P values were obtained from Wilcoxon rank sum test. To improve the visualisation, log-scale was applied to Ferritin and FIB-4 values. Dashed lines highlight thresholds commonly used for FIB-4: 1.3 (blue line) and 2.67 (red line). FIB-4, Fibrosis-4; NFS, NAFLD Fibrosis Score.

Boxplots highlighting the differences in the prediction risks for FIB-4 state-of-the-art threshold and in combination with serum ferritin cut-offs. State-of-the-art thresholds of FIB-4 (1.63 and 2.67) were initially analysed for the risk of liver-related events and mortality. The combinations of high FIB-4 threshold with the main predictive serum ferritin cut-offs (215.5 µg/L for liver-related events and 272 µg/L for mortality, respectively, highlighted in the previous analyses) display an increased predictive risk (green bar) compared with high FIB-4 threshold alone (orange bar). Wilcoxon rank sum test was applied to show the stepwise increase in prediction risk. FIB-4, Fibrosis-4.
Therefore, serum ferritin can significantly improve the predictions of hard outcomes and mortality either alone or in combination with state-of-the-art non-invasive scoring systems.
Discussion
In this large multicentre cohort study with a median follow-up of 96 months, we explored the potential role of baseline serum ferritin values in the prediction of long-term outcomes in patients with biopsy-proven MASLD. In keeping with previous studies, baseline hyperferritinaemia was found in almost one-third of our patients and was associated with higher stages of fibrosis. The longitudinal analysis demonstrates that (1) baseline hyperferritinaemia according to established thresholds is associated with a 50% increased risk of liver-related events and 27% of all-cause mortality; (2) a stepwise increase in baseline ferritin threshold is associated with a parallel increase in the risk of liver-related events and overall mortality: the risk of developing liver-related events mainly increases from the threshold of 215.5 µg/L (on average, HR=1.71 and C-index=0.71) and the risk of overall mortality from the threshold 272 µg/L (on average, HR=1.49 and C-index=0.70); (3) the inclusion of these serum ferritin thresholds (215.5 µg/L and 272 µg/L) in predictive models can increase the performance of FIB-4 and NFS in the longitudinal risk assessment of liver-related events and overall mortality, respectively, and can help the identification of at-risk subjects even for FIB-4 or NFS values in the low-risk range.
Increased ferritin levels are commonly observed in a variety of clinical conditions, characterised by chronic inflammation and oxidative stress that impact iron metabolism, facilitating intracellular iron retention. Cancer and alcohol abuse are two frequent causes of hyperferritinaemia, but ferritin is also an acute phase reactant, and it is often increased in chronic inflammatory conditions such as in individuals with insulin resistance, T2DM and visceral obesity.17 This form of ‘metabolic’ hyperferritinaemia is caused by deregulated pathways in peripheral organs, in particular the adipose tissue.7 18 Proinflammatory cytokines, such as tumour necrosis factor (TNF)-α or interleukin (IL)-1β upregulate the synthesis of ferritin. Hyperferritinaemia is found in up to 30% of patients with MASLD,19 where ferritin levels have been associated with the amount of hepatic fat accumulation and the severity of liver damage.5 Oxidative stress, derived from the accumulation of harmful intermediates of fatty acids from incomplete intracellular oxidation (lipotoxicity), may directly enhance ferritin transcription. As also observed in our cohort, this form of hyperferritinaemia may occur in the absence of increased intrahepatic iron deposition, being rather an epiphenomenon of metabolic dysfunction characterised by normal transferrin saturation and lack of iron overload at histology. Conversely, no signs of iron deficiency potentially affecting serum ferritin levels were observed in our cohort, as no patient had Hb levels below 100 g/L, the median age of the female population was 54 years (limiting the impact of periodic blood loss occurring during the fertile age) and no indirect signs of portal hypertension among the cirrhotic individuals were detected.
While the cross-sectional predictive value of serum ferritin has been explored in other large cohorts, our study is the first to carefully assess the potential predictive value of baseline ferritin levels on the long-term outcomes of MASLD patients.
Most studies on the prognostic role of hyperferritinaemia have been conducted on patients with decompensated cirrhosis, where high ferritin values seem to be associated with increased mortality9 and with a worse short-term prognosis.10 In individuals with chronic liver disease, particularly due to alcohol and hepatitis C, hyperferritinaemia has been associated with liver-related mortality.20 Only one study has been performed on biopsy-proven MASLD individuals so far, where after a follow-up of 16 years, hyperferritinaemia (>350 µg/L for males and 150 µg/L for females) was independently associated with increased mortality (HR 1.10 per year) regardless of different iron overload patterns.11
Our study showed that the inclusion of ferritin levels in a multivariate model analysis significantly improves the predictive performance of clinical/biochemical variables such as age, sex, BMI, type 2 diabetes, AST and ALT. Of note, the risk of liver-related events doubled above the ferritin threshold of 535 µg/L (the 90th percentile in our cohort). Notably, this threshold is very close to the one (550 µg/L) emerged in previous studies in MASLD patients,21–23 in which patients seem to have benefit from iron depletion versus lifestyle changes alone in terms of improvement of liver enzymes.23 Currently, 550 µg/L is the threshold proposed for grade 2 metabolic hyperferritinaemia, possibly associated with increased iron stores.7 Besides liver-related events and overall mortality, a consistent gain in the prediction of extracellular cancers was also observed above the ferritin threshold of 215 µg/L, consistent with the role of serum ferritin as a specific biomarker of cancers, well described in the literature; this aspect deserves attention as extrahepatic cancers represent the second cause of death in patients with MASLD.24 Of note, serum ferritin was found to improve the predictive performance for liver-related events and mortality when combined with non-invasive scoring systems such as FIB-4 and NFS, thus showing that it is an important factor to be considered in the models related to these outcomes. Therefore, our study extends and supports the role of high ferritin in the predictions of hepatic complications and overall mortality, having an additional value on the clinical and biochemical variables usually included in algorithms for the non-invasive prediction of fibrosis and on the currently used non-invasive scores systems, namely FIB-4 and NFS.
The results of this study are supported by the elevated number of well-characterised biopsy-proven MASLD patients, prospectively enrolled and followed up in tertiary centres renowned for their expertise in MASLD, and by the robust analysis, validated by several models. Nevertheless, some limitations of this study need to be highlighted. The whole population represents a tertiary-level hospital referral, which might not reflect the same prevalence and the same characteristics when compared with the general population. The small amount of HCC developed during the follow-up may have affected the strength of the predictive models and limited the reliability of the results. In addition, data about the cause of death were missing, as well as the interval time between the event and the baseline biopsy.
In the landscape of MASLD, the availability of non-invasive prognostic biomarkers still represents an unmet need and liver histology remains the most reliable tool for prognostication.24 25 In this perspective, we extended the well-established association between hyperferritinaemia and fibrosis4–6 to a significant predictive performance of high ferritin levels for the risk of incident hard outcomes.
In conclusion, this longitudinal study strongly suggests that ferritin levels should be considered as an additional tool in the risk stratification of patients with MASLD, particularly in terms of liver-related events and overall mortality, and this finding deserves to be validated in prospective cohort studies.
Data availability statement
All data relevant to the study are included in the article or uploaded as online supplemental information.
Ethics statements
Patient consent for publication
Ethics approval
The study protocol was approved by appropriate regulatory bodies in all participating centers, and all patients gave their written informed consent.
References
Supplementary materials
Supplementary Data
This web only file has been produced by the BMJ Publishing Group from an electronic file supplied by the author(s) and has not been edited for content.
Footnotes
AA and TS are joint first authors.
X @AngeloArmandi, @Dina Tiniakos, @lucavalenti75, @lmiele74, @hanneshagstrom, @mromerogomez
AA and TS contributed equally.
Correction notice This article has been corrected since it published Online First. An affiliation has been added for author Marco Zaki.
Contributors Manuscript concept and design: AA and EB. Writing: AA and TS. Data collection: RY, GPC, CR, OG, AL, PFrancione, RG-D, JA, GP, RA, DT, AB, ED, FV, MM, DC, DM, MJP, MYWZ, AG, PS, SK, ALF, LV, LM, ME, SP, HH, JG, JMS, MR-G and QMA. Statistical analysis: TS and PFariselli. Revision and editing: EB, QMA, MR-G, JMS, JG, HH, SP, LM, LV, ALF, SK, PS and PFariselli. Acceptance of the final version: all authors. EB is responsible for the overall content as guarantor.
Funding EB is supported by the Italian Ministry for Education, University and Research (MIUR) under the programme 'Dipartimenti di Eccellenza 2018-2022' Project code D15D18000410001. SP has received funding under PNRR M4C2I1.3 Heal Italia project PE00000019 CUP B73C22001250006, Italian PNRR-MAD-2022-12375656 project, Italian RF-2021-12372399 project and Italian PRIN-2022 2022L273C9 project. ALF is supported by: Ministry of Health grant Ricerca Finalizzata RF-2021-12374481 'Identification of lipid biomarkers to dissect hepatic and cardiovascular complication in NAFLD adult and children patients through a lipidomic approach'. JG is supported by the Robert W. Storr Bequest to the Sydney Medical Foundation, University of Sydney; a National Health and Medical Research Council of Australia (NHMRC) Program Grant (APP1053206), Project, Ideas and Investigator grants (APP2001692, APP1107178, APP1108422, APP1196492) and a Cancer Institute, NSW grant (2021/ATRG2028).
Competing interests LM is supported by Investigator Driven Grants: Gilead, Intercept, Siemens Healthineers. Advisor/Consultancy: Alfa-Sigma, Boehringer-Ingelheim, BMS, Echosens, Galmed, Gilead Sciences, IBSA, Intercept, MEDA, MyGenomics, Merck Sharp & Dohme, Novartis, Pfizer, ProLon, Promethera, Resalis, Rottapharm-Madaus, Siemens Healthineers, Synageva. HH’s institutions have received research funding from Astra Zeneca, EchoSens, Gilead, Intercept, MSD, Novo Nordisk and Pfizer. He has served as consultant or on advisory boards for Astra Zeneca, Bristol Myers-Squibb, MSD and Novo Nordisk and has been part of hepatic events adjudication committees for Boehringer Ingelheim, KOWA and GW Pharma.
Patient and public involvement Patients and/or the public were not involved in the design, or conduct, or reporting, or dissemination plans of this research.
Provenance and peer review Not commissioned; externally peer reviewed.
Supplemental material This content has been supplied by the author(s). It has not been vetted by BMJ Publishing Group Limited (BMJ) and may not have been peer-reviewed. Any opinions or recommendations discussed are solely those of the author(s) and are not endorsed by BMJ. BMJ disclaims all liability and responsibility arising from any reliance placed on the content. Where the content includes any translated material, BMJ does not warrant the accuracy and reliability of the translations (including but not limited to local regulations, clinical guidelines, terminology, drug names and drug dosages), and is not responsible for any error and/or omissions arising from translation and adaptation or otherwise.
Linked Articles
- Commentary